European Market Review: Mix Shift Influences ADR Growth as Demand Soars
Travelers Have Favored Larger Home Listings Since 2020
Available listings in Europe finally returned to pre-pandemic levels at the beginning of 2023. Last year turned out to be one of accelerated listing growth, pushing available listings to a new milestone last month: available listings now exceed 2019 levels by more than 20%. Not all property types have enjoyed the same growth, however.
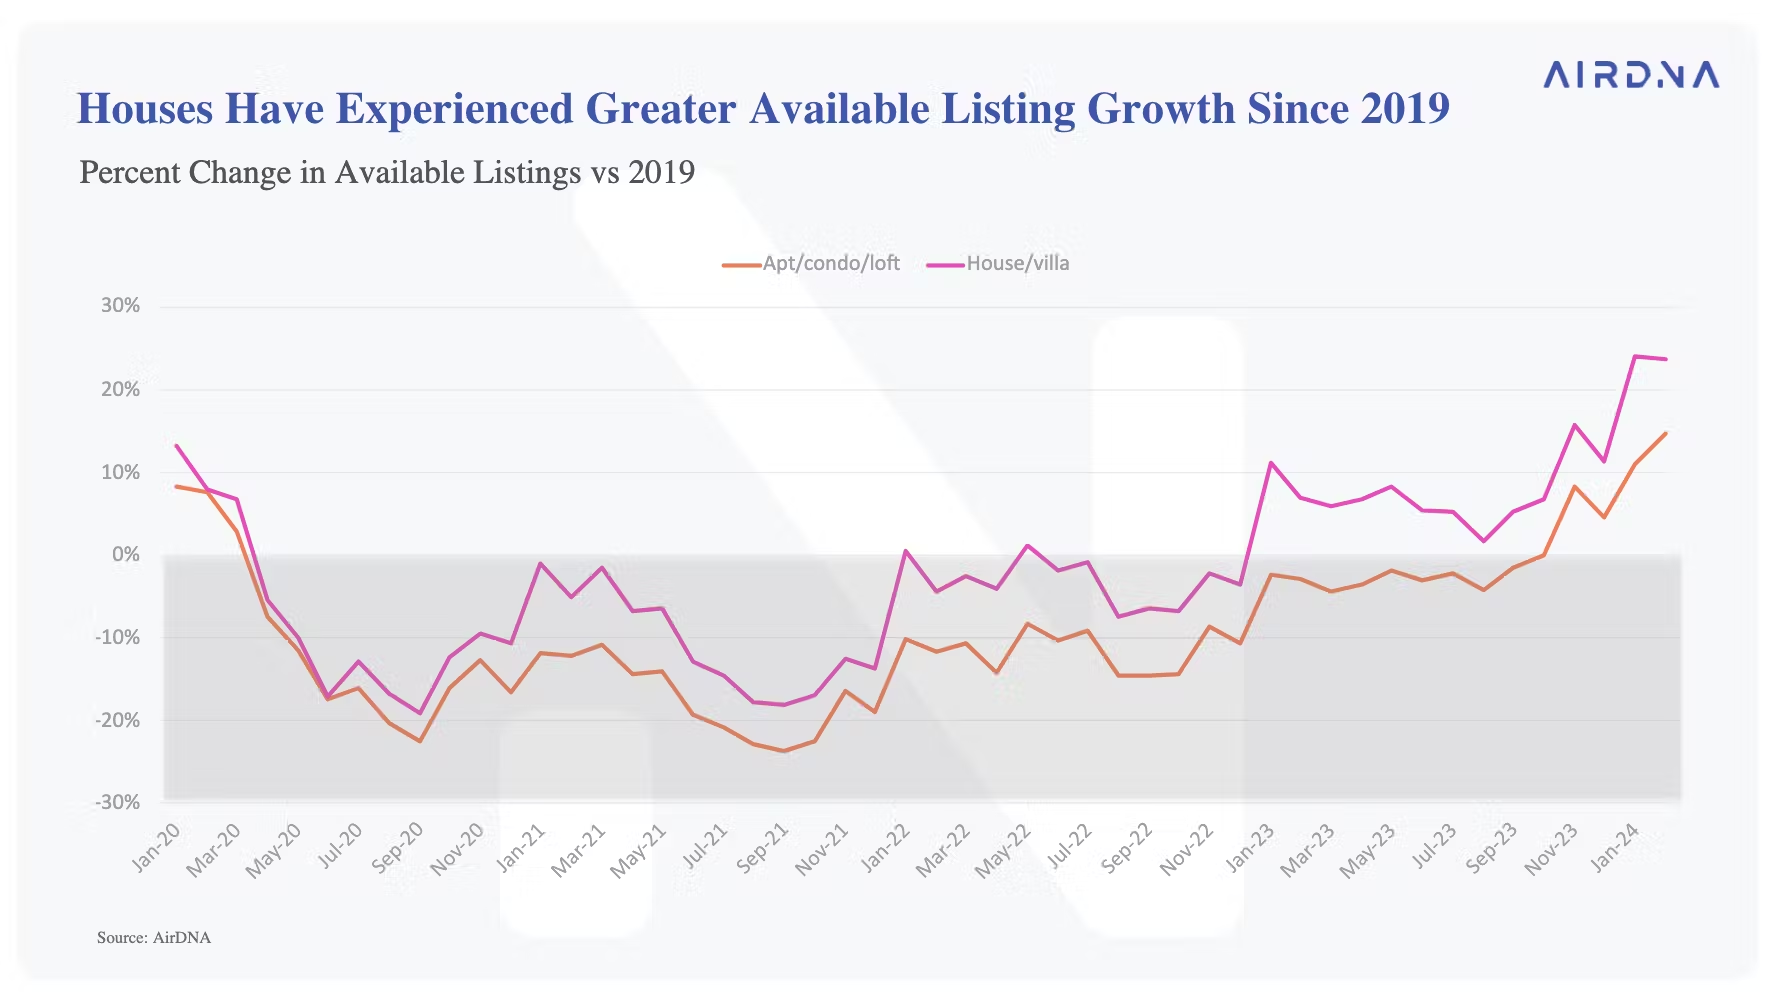
Over the last four years, the composition of available listings has shifted greatly. In 2020 and 2021, when demand left cities, apartment listings reached a low of 25% of properties on the market. Meanwhile, houses became increasingly popular during the pandemic and only experienced a decline of about 18%.

Apartments have recovered over the last two years as demand has returned to cities, but listings for single-family homes have grown even more. As of February 2024, there were 24% more house listings than in February 2019 but only 15% more apartment listings.
New listings have significantly fueled the growing number of houses on the market. After the pandemic slowdown, new listing growth picked back up in 2022. That year, we saw new listing growth favor houses; new house listings grew 52% YOY, while new apartment listings grew 49% YOY.
In 2023, new house listings continued to grow at a faster rate than apartments, growing 19% YOY compared to 15% growth among apartments. Apartment listings last year made up 60% of new listings while houses made up 34%, a notable shift compared to 2019, when apartments and houses accounted for 62% and 32%, respectively.

The Impact of New Listings on European ADR Growth
New listings not only impact the composition of available listings over time, but they can also substantially shift the aggregate ADRs in a market. For example, new listings that enter a market could have significantly higher ADRs than existing listings and increase that market’s overall ADR—despite fairly steady ADRs for existing properties.
A look at ADR performance in Europe over the last few years highlights how new listings can affect the overall performance of a market. Before the pandemic, ADR and RRI growth were fairly comparable. This changed dramatically during the pandemic.

In 2020 and 2021, supply shortages and a demand shift toward larger properties boosted RRI growth for existing supply. Additionally, the mix shift led to significantly higher ADR growth than RRI after larger and more expensive properties entered the market and drove up ADRs across Europe.
In the first half of 2022, ADR and RRI growth slowed at similar rates. Going into 2023, though, the gap between the two began to increase. New listings capitalizing on the return of international travelers posted higher rates than existing properties, causing overall ADR growth to exceed RRI.
In the second half of 2023, RRI growth caught up with ADR growth. However, we’ve seen a slowdown in both recently, as slipping occupancy may be chipping away at hosts’ pricing power. In the first few months of 2024, ADR grew 6.4% YOY while RRI grew 4.8%.
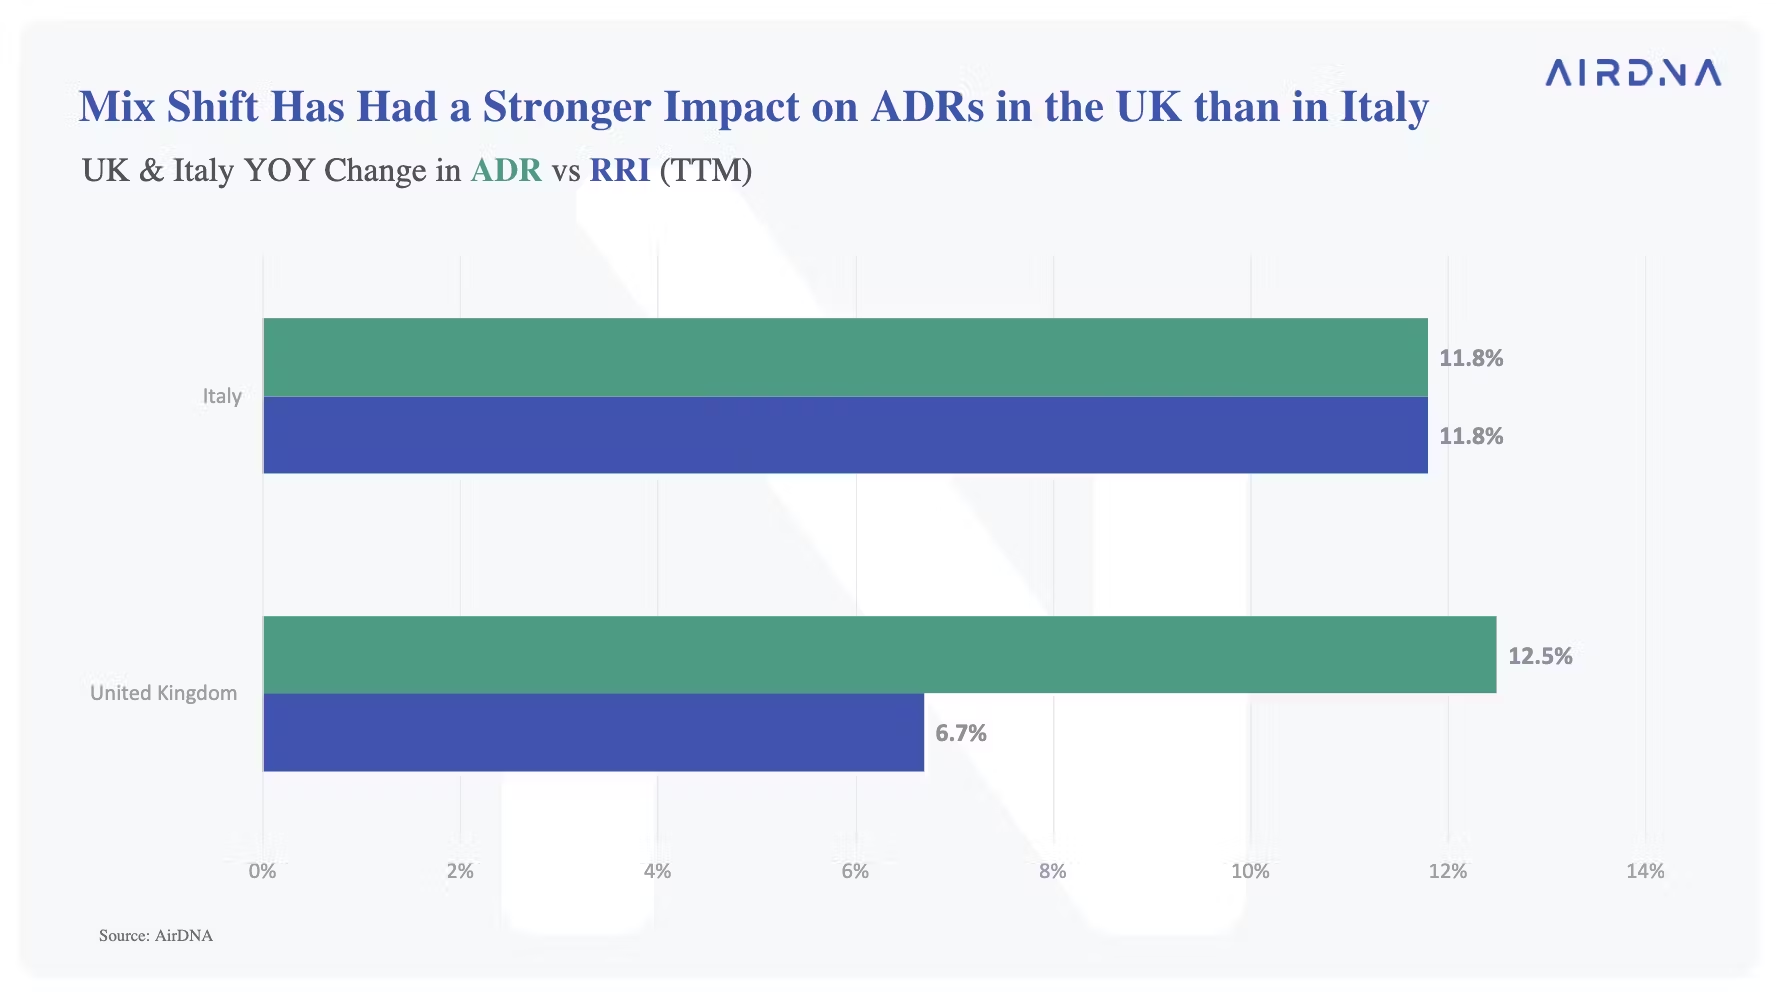
Mix shift doesn’t seem to have a uniform effect on ADR across Europe’s largest STR markets. New listing growth in the United Kingdom over the last few years has fallen in line with broader European trends, favoring larger properties. New house listings in the UK grew 22% YOY in 2023 compared to the 16% growth in apartment listings. Greater growth among larger and more expensive properties in the last year has driven a 12.5% YOY increase in ADR across the UK, exceeding the 6.7% RRI growth.
Italy offers a stark contrast to the UK. There, RRI and ADR have grown similarly, suggesting that new listings in the last year are having a more moderate impact on Italian ADRs. New listings in Italy, the majority of which are apartments, have so far been priced in line with existing listings. Both ADR and RRI growth for the Italian market averaged 11.8% in the last year.

Occupancy Increased in 12 of the Top 20 European Countries
In early 2024, 18 of the top 20 European countries experienced double-digit demand growth YOY.
Warm-weather destinations led occupancy growth early in the year as some travelers escaped cooler climates. Those seeking sun traveled to Spain, Croatia, and Italy, driving occupancy growth over 3% YOY as demand far exceeded supply.
- In Spain, a 30% YOY increase in demand pushed occupancy up an impressive 10% YOY.
- Over in Italy, demand grew 17% YOY while supply grew just 13.2%, leading to a 3.4% increase in occupancy compared to February 2023.
Other travelers sought colder climates and snowy slopes and traveled to Norway and Sweden to find them.
- Demand in Norway was up 56.3% YOY last month
- Demand in Sweden saw 38.8% growth.
Despite strong listing growth in both countries, demand in the early months managed to exceed supply and drive up occupancy.
- Occupancy grew 7.4% YOY in Norway
- Sweden experienced 3.9% occupancy growth.
Meanwhile, supply growth in a few countries lagged.
- Greece (-10.2%)
- Ireland (-3.9%)
- Poland (-3.8%)
All 3 countries saw occupancy declines of over 3%, as YOY supply growth in each country far exceeded YOY demand growth.
Europe Demand Pacing and Spring Break
European hosts have a lot to look forward to. Pacing remains strong, with current demand on the books up 16.9% YOY for at least the next six months.
YOY demand growth for April grew minimally, thanks to Easter’s shift from April to March. May, on the other hand, is already seeing a 28% YOY growth in demand pacing, while the summer months (June – August) are currently seeing a 20% YOY growth in demand pacing.
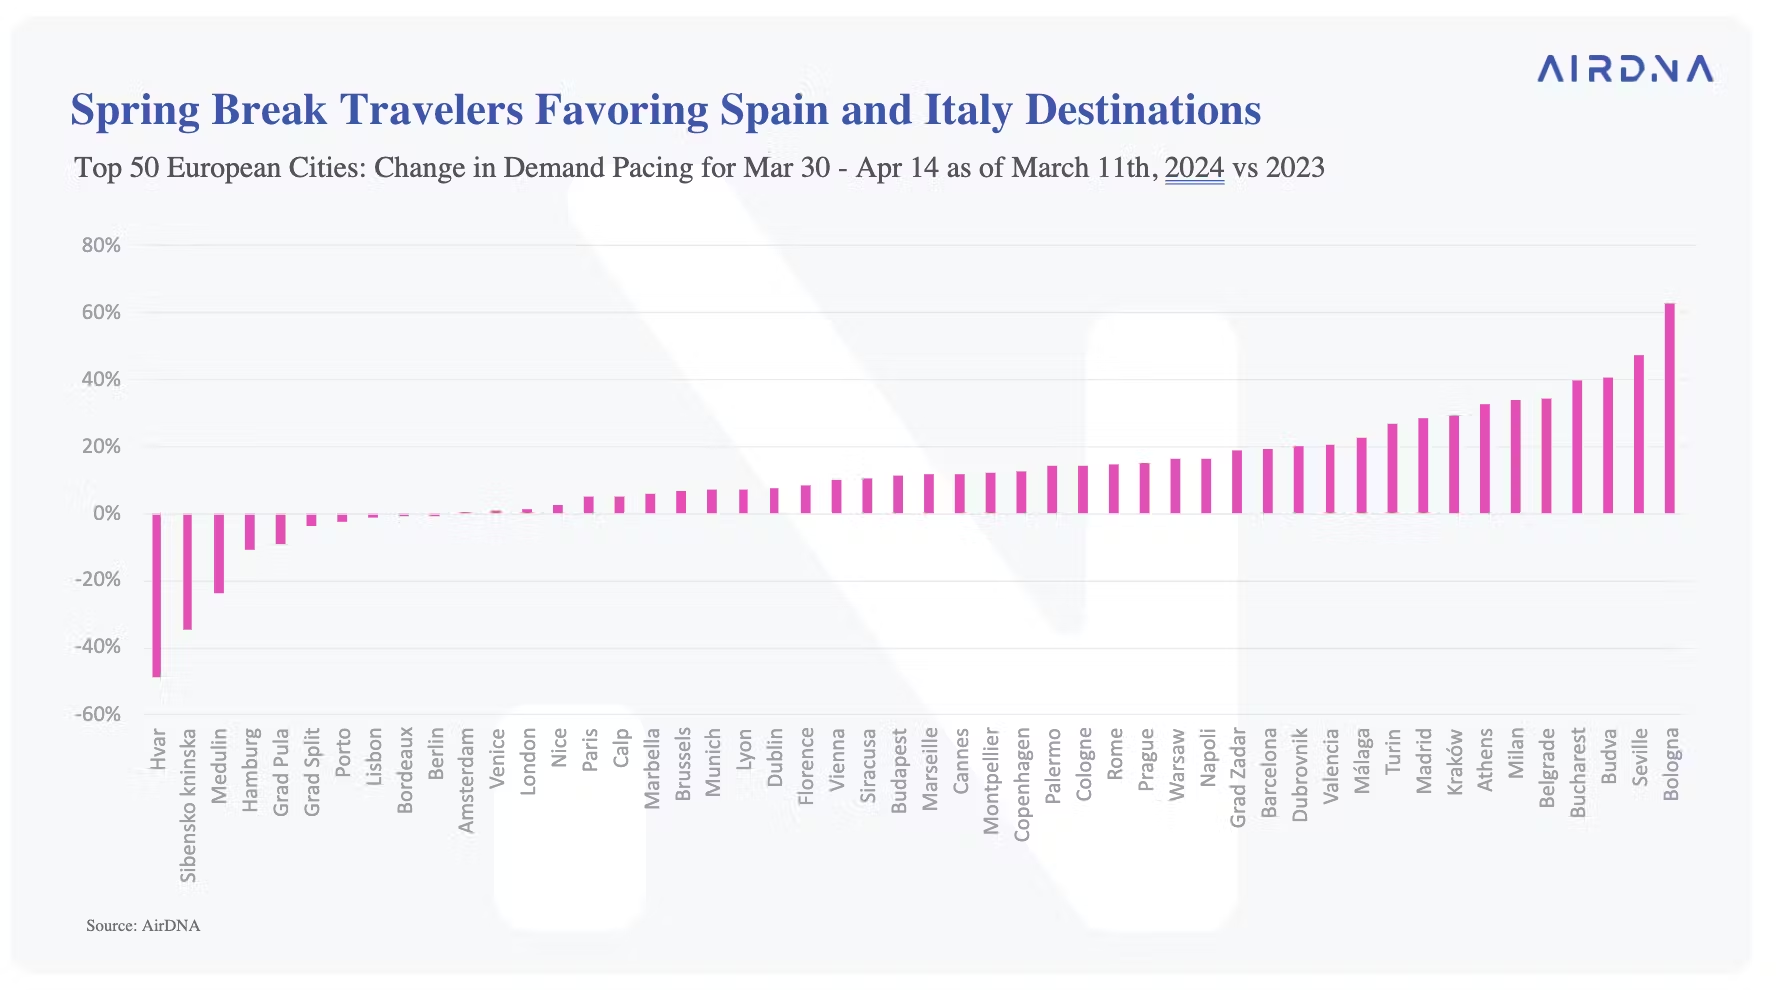
Spring break pacing was still favoring Spanish and Italian destinations. The top two destinations with the most YOY demand growth so far were Bologna, Italy (+63% YOY), and Seville, Spain (+47% YOY).
Demand for eastern European destinations Budva, Montenegro, and Bucharest, Romania, were also trending upward, with demand up 41% YOY in Budva and 40% YOY in Bucharest.


@DavidGidet great article – thought you may be interested .
Thanks Katie! Very intersting indeed!